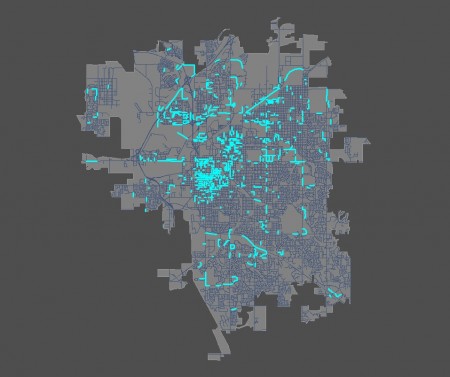
Lincoln’s One Percent
By: Mr. Wilson on
July 29, 2013
 As it turns out, 5% of Lincoln's street segments were responsible for an impressive 81% of crime. And 1% were responsible for 41%. That's some pretty concentrated naughtiness.
These data raise myriad questions. I can't even begin to ask them all here. One that jumps out at me, though, is how 2012's data compare to data from other years. Wouldn't it be cool, for example, to see how crime concentration has evolved? Perhaps back in 1980 5% of the street segments were only responsible for 40% of the crime. Or maybe it was 90% back then. Or maybe the numbers actually don't change all that much. Any of those scenarios is interesting to me.
It's probably a good thing I'm not a grad student with access to the data and mapping tools that Casady has. I'd wind up creating umpteen million maps and not actually getting any work done.
Comments
See what your friends and neighbors have to say about this.
I like that our public safety team is using technology to keep track of problem streets. I hope they step-up enforcement in those areas using cameras, bike cops, undercover cops, neighborhood watch programs, etc. I don’t think anyone in Lincoln wants a “high crime” street in their neighborhood.
Who wants to bet 6100 O St reports more crimes than any other street segment? I’m not sure removing retail theft would give more meaningful data (I’d still want to know about the the gas station around the corner) but it’s definitely skewed in places with large retail populations that share the same address.
Share your thoughts with the community.
Commenting is no longer permitted on this post.